On November 11, 2026, TechFlow published a Chinese compilation of a Binance Research note by Kim Lim and Jasper Jin. The note asks why institutional money has entered crypto mainly through passive products while actively managed crypto hedge funds remain much smaller. Its data run through October 31, 2026, on Binance’s Capital Connect platform, with interviews of allocators and managers from October 29 to November 1.
This is one research desk’s reading of surveys, ETF totals, and activity on a Binance platform. It is not a market-wide census. The report says it is not a forecast or an investment recommendation.
Passive products took the institutional money
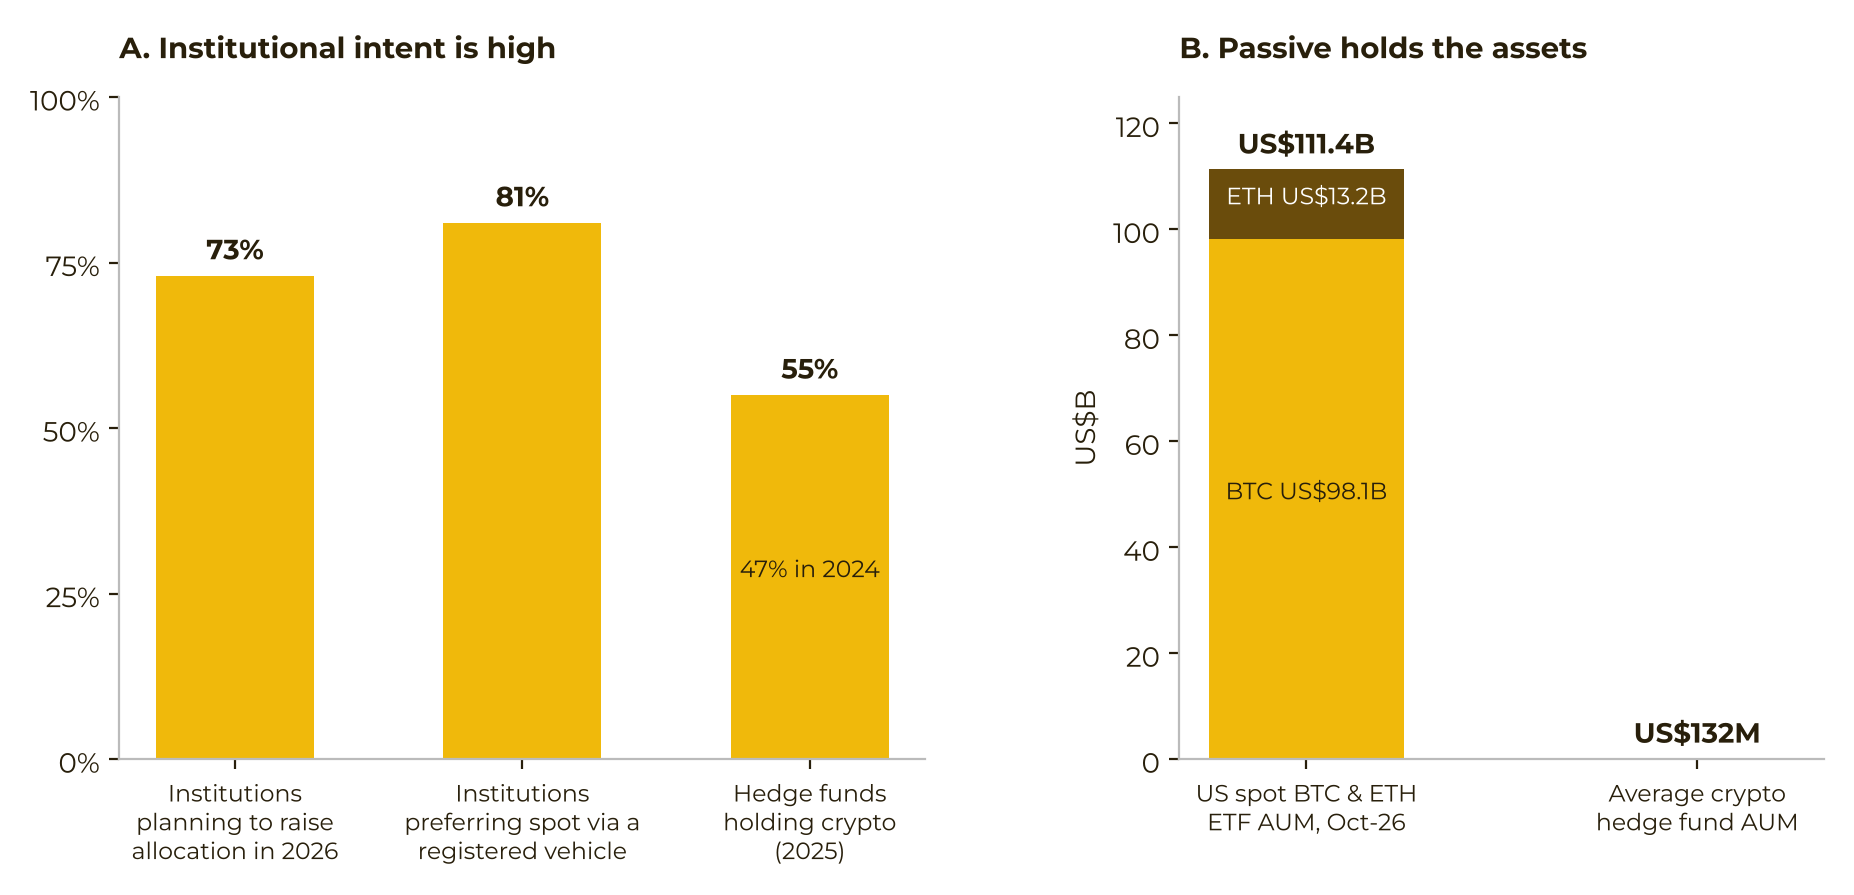
Binance Research cites a 2026 EY-Parthenon and Coinbase survey in which 73% of institutions said they planned to raise digital-asset allocations that year. An AIMA and PwC report put the share of traditional hedge funds holding crypto at 55%, up from 47% in 2024. Among institutions in the surveys the note uses, 81% preferred registered, compliant products for spot exposure.
The size gap that follows is stark. By the end of October 2026, US spot Bitcoin and Ethereum ETFs held about $111 billion combined, using figures the note attributes to SoSoValue and related sources. Crypto hedge funds averaged about $132 million, and 91% were under $1 billion. The comparison draws on the EY-Parthenon and Coinbase institutional survey from March 2026, the AIMA and PwC 2025 global crypto hedge fund report, a State Street digital-asset survey from October 2025, SoSoValue, and Binance Research, with the ETF and platform cutoff dated October 31, 2026.
Stated interest did not mean large positions. Among traditional hedge funds that already held crypto, more than half allocated less than 2% of total assets. Separately, 60% of institutions in the cited material planned to lift exposure above 2% within a year.
The authors’ view — explicitly an interpretation — is that this split reflects missing infrastructure, not a shortage of managers. Spot ETFs package custody, audits, daily net-asset-value pricing, and reporting formats institutions already know. Active crypto strategies, they argue, have not offered an equivalent wrapper.
Manager search is still mostly informal
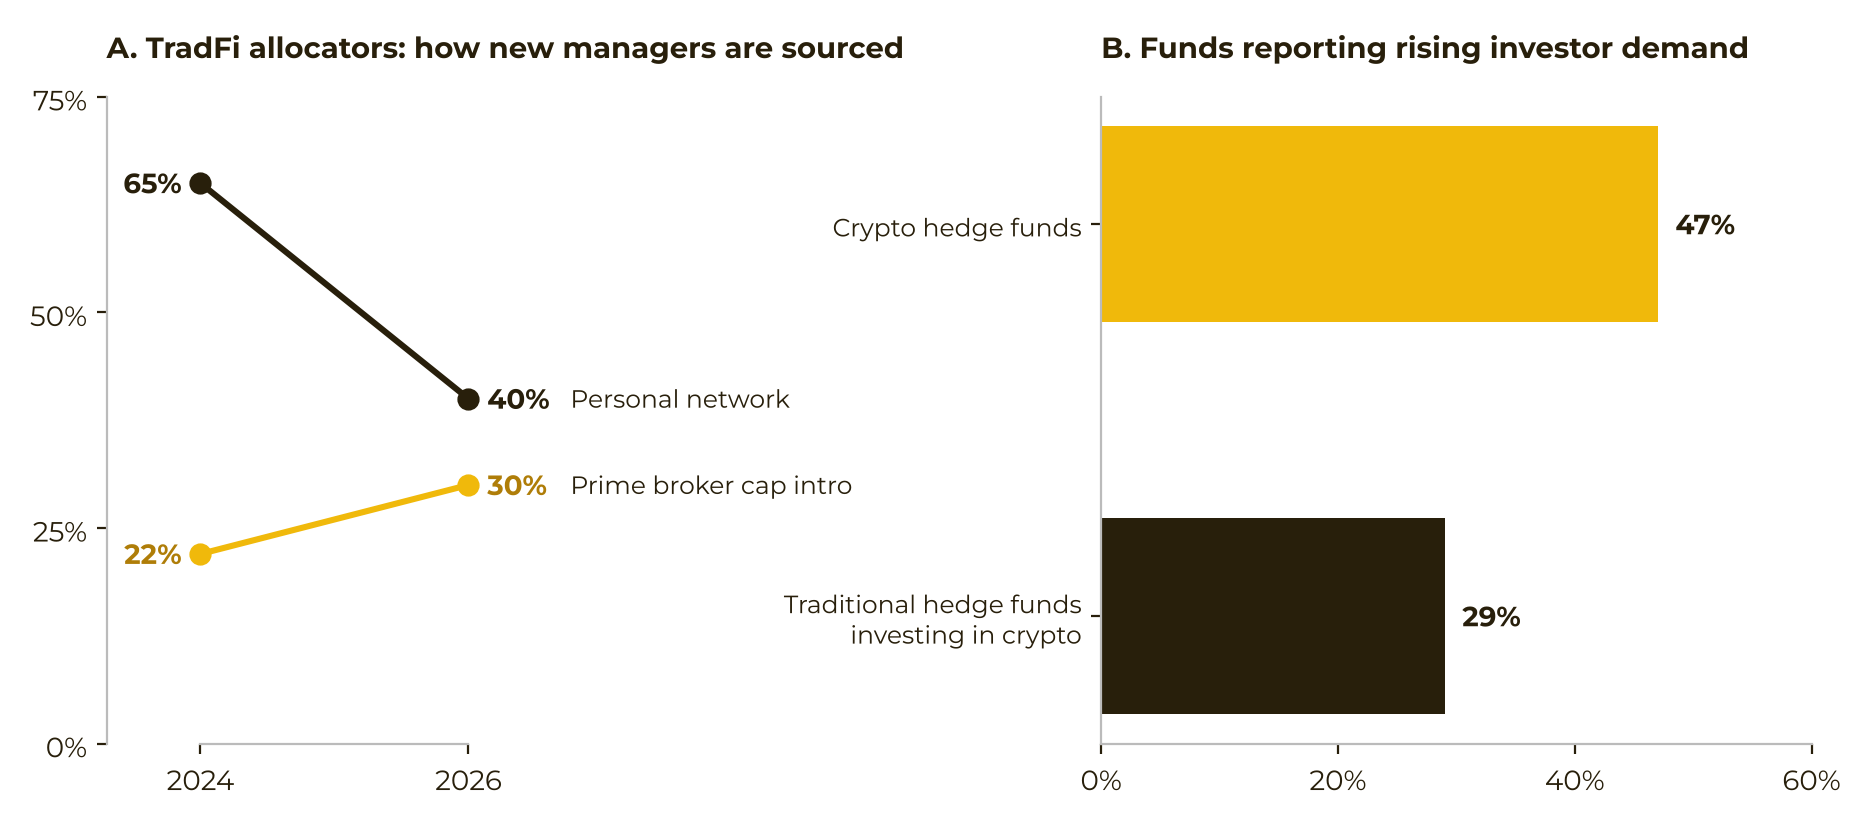
In traditional markets, how allocators find managers has been shifting. AIMA and Marex research cited in the note says reliance on personal networks fell from 65% in 2024 to 40% in 2026, while capital introduction through prime brokers rose from 22% to 30%.
Crypto, the authors say, still lacks a matching standard channel. Allocations often still move through Telegram groups, conferences, and personal introductions. Without a shared performance and benchmark framework, investors cannot compare managers on the same terms, and institutions have trouble checking audited financials, custody arrangements, and service-provider credentials.
The friction cuts both ways. The note says 47% of crypto hedge funds reported rising investor demand, versus 29% of traditional hedge funds involved in crypto. Family offices and high-net-worth individuals were still the main backers. Only about one-fifth of crypto hedge funds listed pensions, endowments, or sovereign wealth funds as a primary investor type — up from about one-ninth a year earlier, but still a minority.
On one platform, fund count and capital diverge
Capital Connect is described as Binance’s regulated platform for discovering and allocating to crypto funds. Strategies on it must disclose publicly, and results are measured to a common standard. Binance Research presents the platform as the distribution layer the market lacks. That is the operator’s thesis. The figures below describe this platform, not every crypto fund.
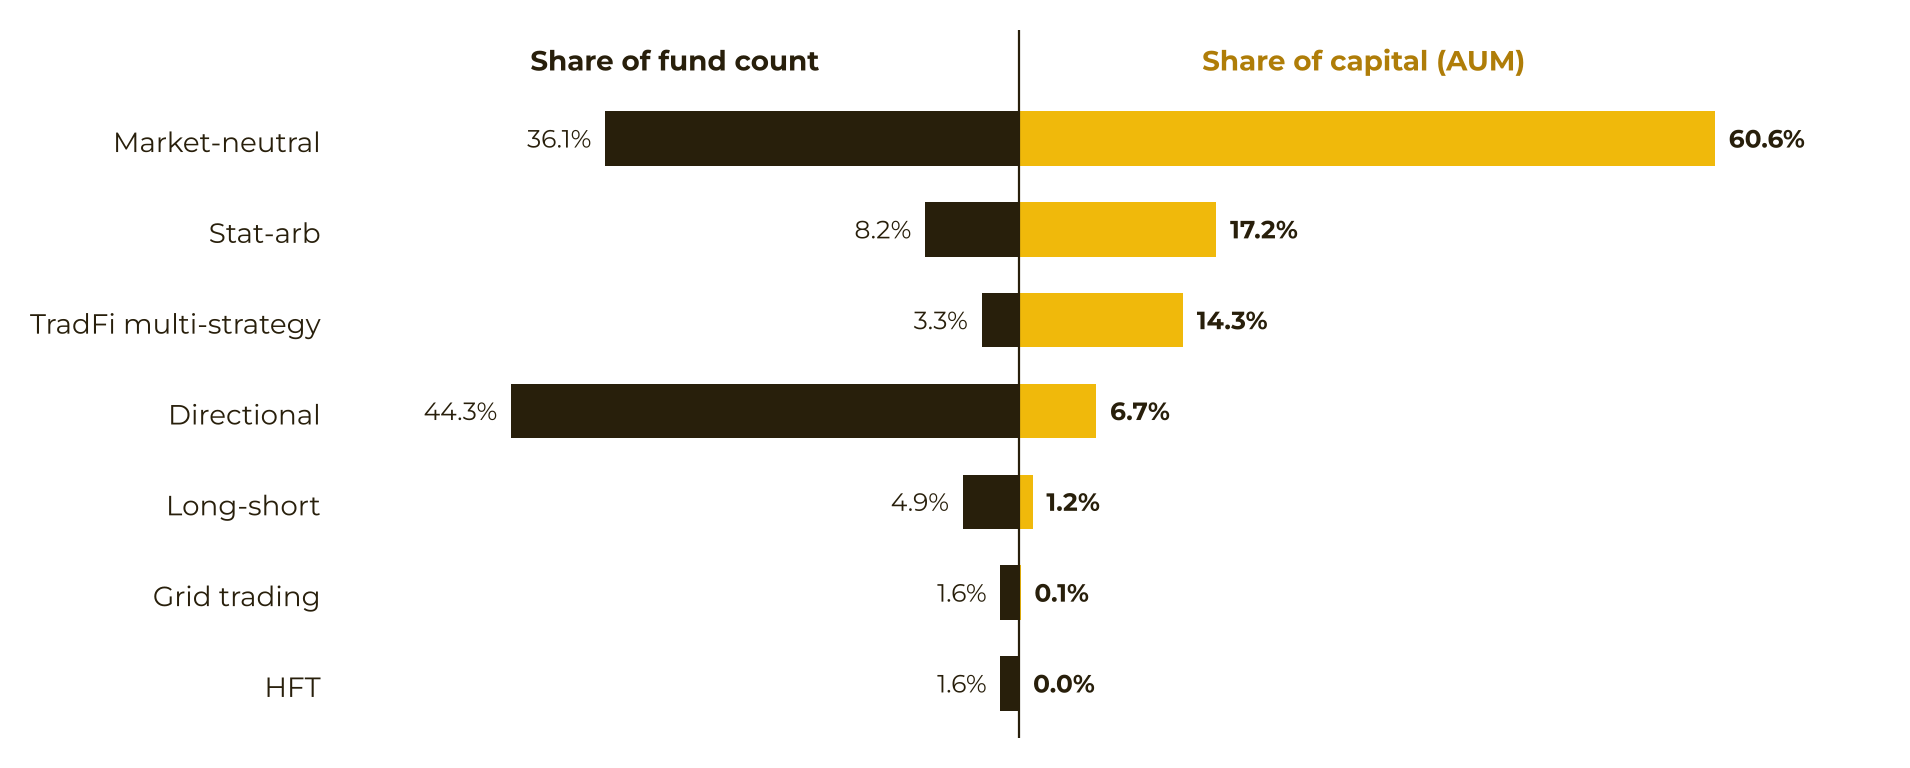
As of October 31, 2026, directional strategies were the largest group by count, at 44.3% of funds, but they held only 6.7% of platform assets. Market-neutral, statistical-arbitrage, and traditional-finance-style multi-strategy funds together held 92.1% of assets. Multi-strategy alone was 14.3%. The summary also says neutral-strategy funds were under half the fund count while taking 92.1% of platform capital — the same capital share the detailed breakdown assigns to that broader hedged group.
Average ticket size for neutral strategies was about 11 times the directional average. Market-neutral investor participation had risen for two straight months and was up 30% since May. Statistical-arbitrage participation had more than doubled over that same stretch and stayed steady through October.
The authors treat this as revealed preference rather than a side effect of how many funds exist. Long-tail managers keep offering directional products. Capital on this platform clusters in hedged strategies. A discovery layer, they say, does not create that preference. It makes it visible.
Two ways of handing over capital
Two mandate styles were both growing, and October’s decline was used as a stress check.
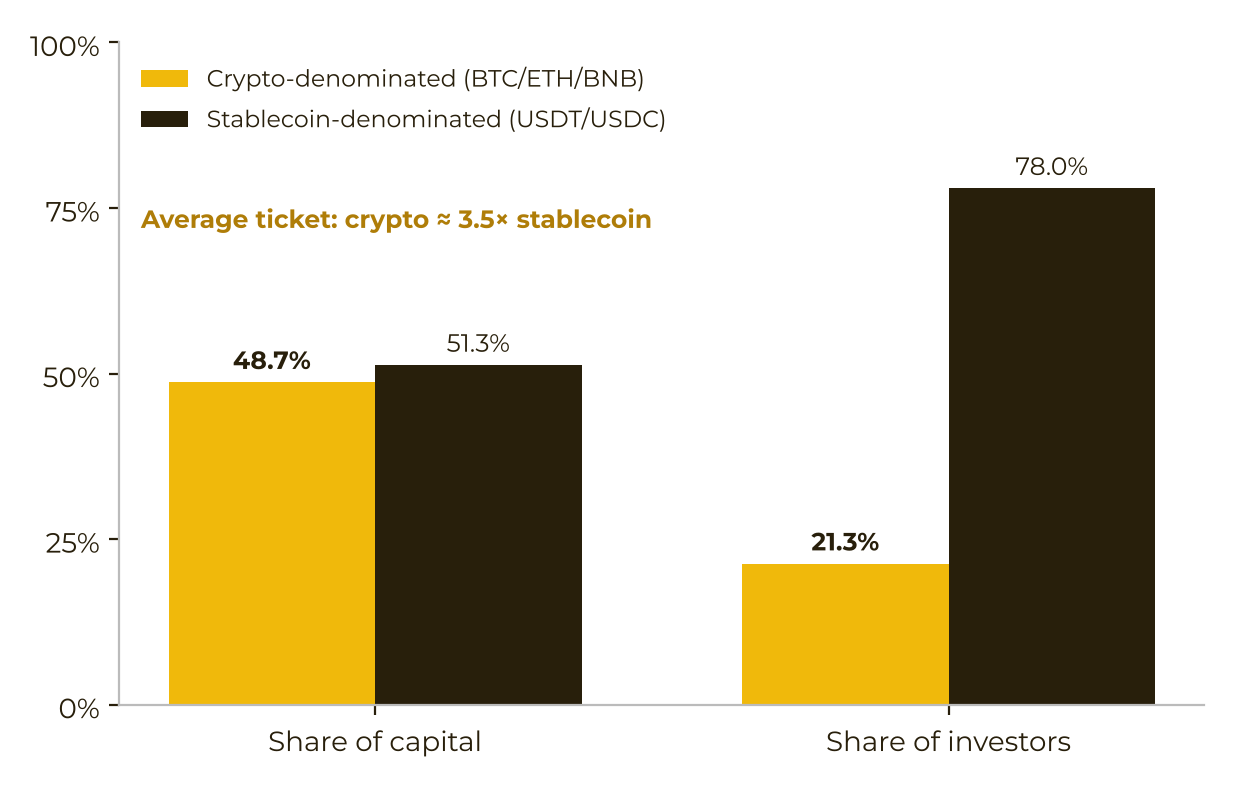
The first is crypto-native. Close to half of platform capital, 48.7%, sat in funds denominated in BTC, ETH, or BNB. Those funds accounted for about one-fifth of investors, but the average subscription was about 3.5 times that of stablecoin-denominated funds. Allocators keep the underlying-coin exposure and outsource the hedge. In October, coin-denominated holdings of the underlying assets stayed stable. The pullback in dollar-measured assets mostly tracked Bitcoin’s price.
The second is what the note calls convergent: traditional-finance-style multi-strategy funds. They remained the third-largest strategy by assets, at 14.3%. Investor count in that sleeve fell 14% month over month in October, from 21 to 18. The authors call that maturation rather than a reversal. Institutions will use a familiar structure, but they still screen, and some stepped back even where returns were described as steady.
Directional interest returned, then met a 7.2% Bitcoin drop
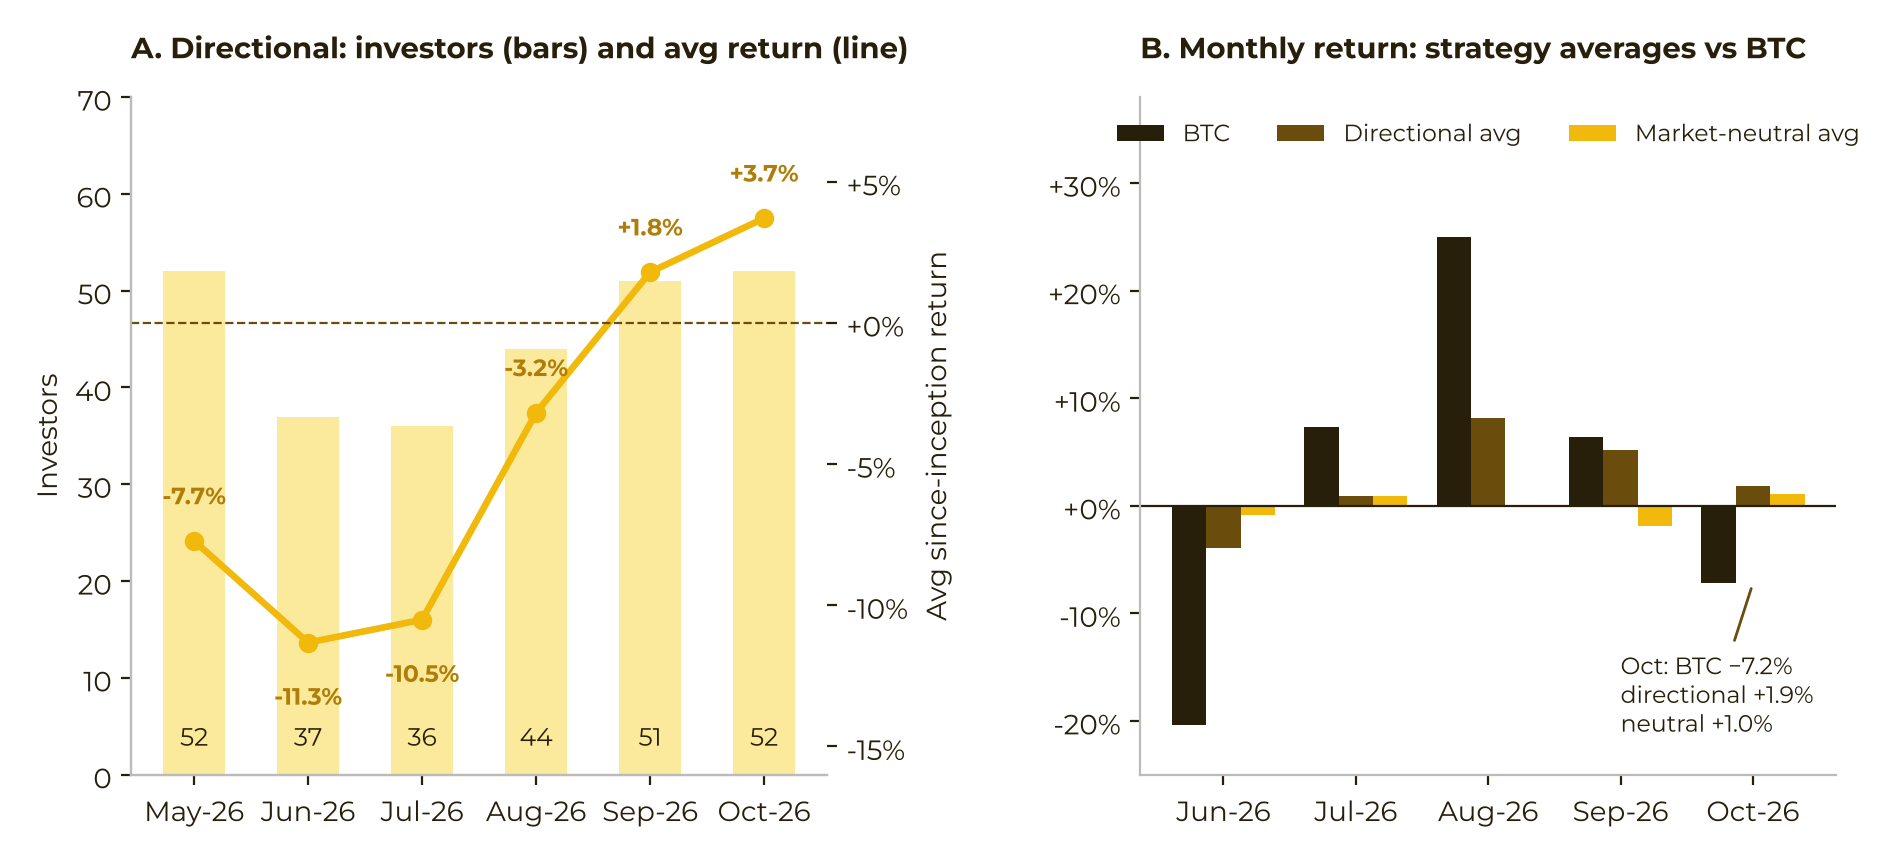
Directional participation had been repairing along the path the note describes. After returns bottomed in June, investor count in the sample fell to 36 in July, then recovered to 52 by October, back to the May level. Average since-inception return for directional funds improved from −11% in June to +3.7% in October.
October was framed as the first live test of that repair. Bitcoin fell 7.2%. Directional funds still averaged +1.9% for the month. Market-neutral funds averaged +1.0%. Interviews described a repeated habit: allocators cut directional exposure in drawdowns and add it back after volatility and liquidity settle. That is reported behavior in this sample, not evidence the pattern will repeat.
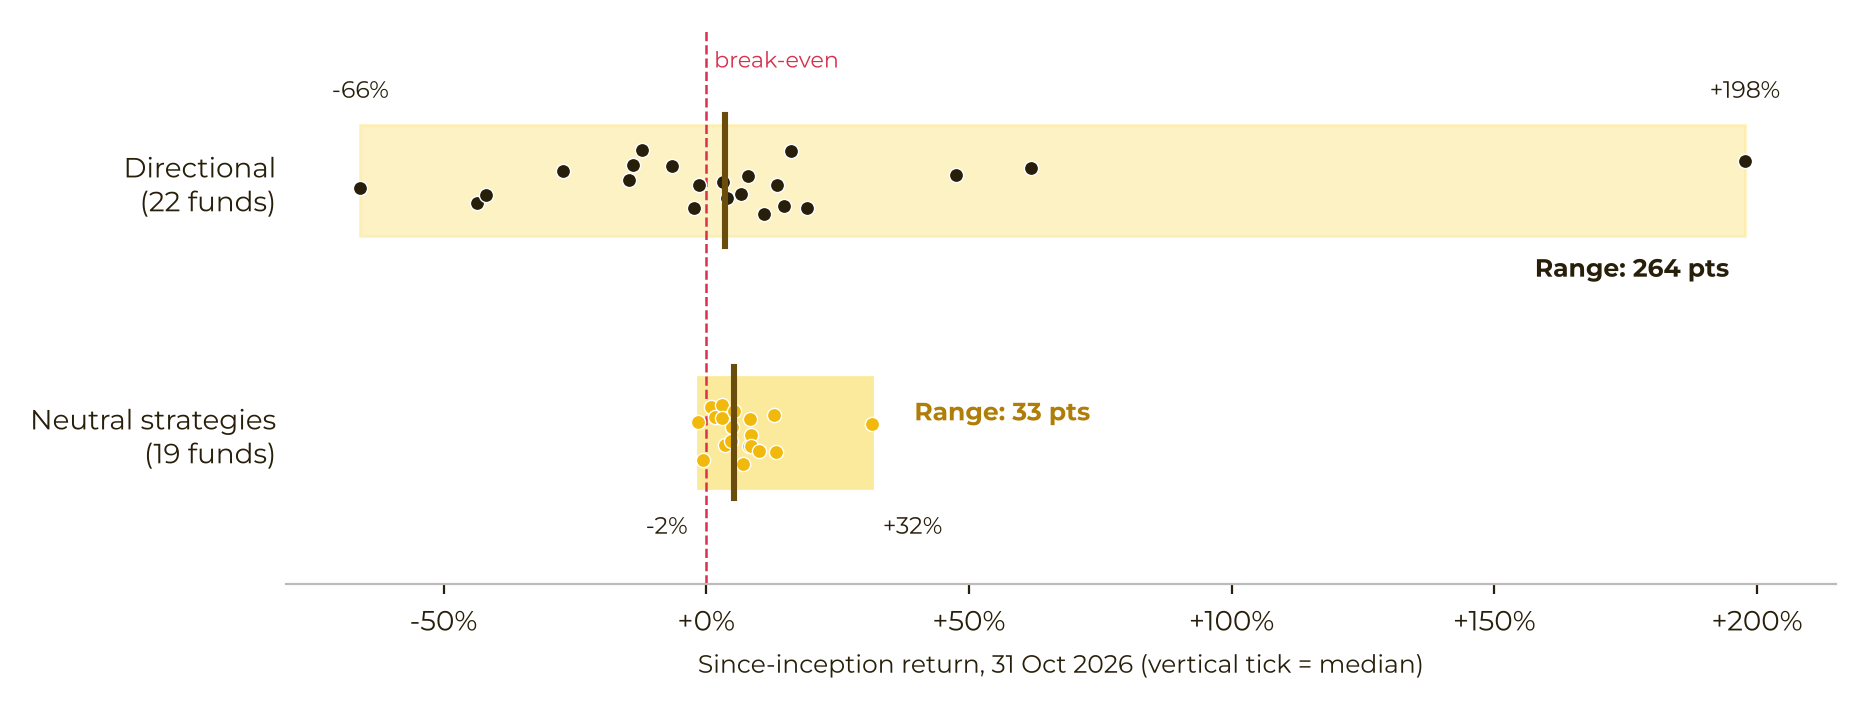
Dispersion is the unresolved part. The gap between the best and worst directional funds was about eight times the gap among neutral strategies. The directional median was around +4%, and only 55% of those funds were positive. Nine in ten neutral funds were positive. The measurement rules matter: strategy returns are a simple average of fund net asset values; dormant funds and funds under $1,000 are excluded; the neutral bucket includes market neutral, statistical arbitrage, and traditional-finance multi-strategy. Bitcoin’s move is Binance’s BTC/USDT series.
The top quarter of directional funds averaged +69% since inception. Allocators told the researchers they would still pay for that kind of result if drawdowns stayed controlled. The report does not show that outcome is typical, and it does not treat past platform results as a forecast.
Interviews put safety and proof ahead of the return
Binance Research interviewed allocators and trading teams on Capital Connect. For allocators, asset security came first: 80% ranked it above historical performance and firm reputation. Every allocator interviewed said verified exchange-internal data materially strengthened due diligence. They weighted drawdown control more than a high headline return.
Managers described the fundraising obstacle as trust cost, not dull returns. Track records are hard to cross-check. KYC, anti-money-laundering review, and counterparty compliance slow the process, so most capital still comes through personal referrals. After listing, some managers said they reached a wider set of investors, compliant institutions, and pools built from smaller tickets.
In the authors’ summary, both sides pointed the same way: verifiability opens trust, and operating infrastructure widens the channel. The interview window is October 29 to November 1, 2026. The note does not publish a full sample size beyond the shares it states.
What this does not settle
The cited surveys report real institutional interest, and the ETF total is far larger than the average active crypto fund in the comparison. What is not established is the causal claim that a missing distribution-and-verification layer is the main reason active strategies have not scaled — or that this platform is what closes the gap. The evidence is one platform’s book, third-party surveys with their own dates, and interviews run by that platform’s research arm.
The performance figures are averages and ranges inside that sample, not a market benchmark. The original report says its sources are not guaranteed complete or accurate, that forward-looking comments may not occur, and that nothing in it is an offer, a forecast, or investment advice.
Original article, published November 11, 2026: TechFlow compilation of the Binance Research note.